PRODUCTS
Hyperspectral Image Map of the Moon in Visible and Near Infrared Wavelengths
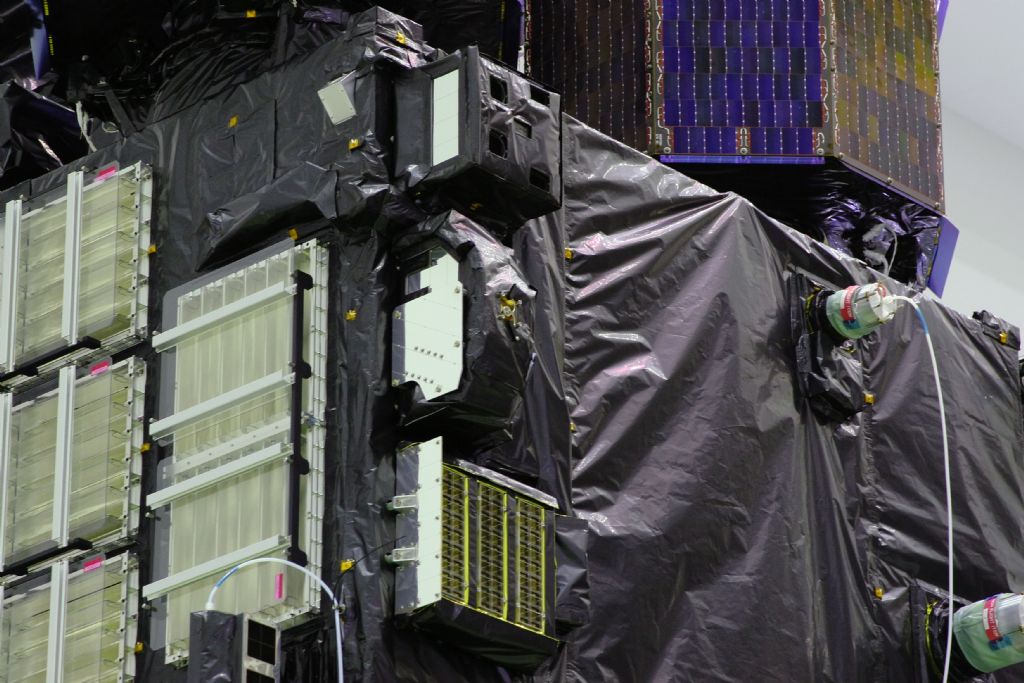
About the KAGUYA Spectral Profiler (SP)
KAGUYA (SELENE) orbited the Moon and observed from September 2007 until June 2009. The Spectral Profiler (SP) is an instrument that observed light in the 500-2600 (visible and near-infrared) μm wavelength range at intervals of every few nanometers while orbiting approximately 100 km above the lunar surface. In a single exposure, the SP obtains spectroscopic observation data (reflected light intensity at different wavelengths) from an approximately 500-meter swath in one location. SP retrieved observation data from roughly 70 million spots as KAGUYA orbited the Moon approximately 7,000 times.
Mechanical details of SP
https://www.selene.jaxa.jp/index_e.htm
Research papers of SP:Matsunaga et al. (2008); Yamamoto et al. (2011); Yamamoto et al. (2014)
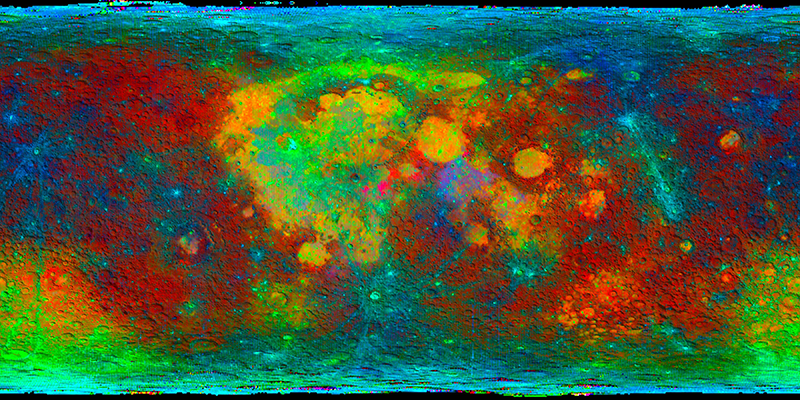
Global Moon Surface Albedo Map
The data product introduced showed on this page is a 1° and 0.5° latitude and longitude mesh (grid) global Moon surface albedo map produced from SP data. 1° latitude and longitude correspond to approximately 30 km at the Moon’s equator. The SP is not a camera, but it was able to produce the global map image by collecting data from within each grid square(Yokota et al. 2011).It includes 160 bands in the 0.51-1.65 μm wavelength range with which it was produced. The top image on this page (0.5° grid) uses a combination of four bands (0.51, 0.75, 0.95, and 1.55 μm) to emphasize a color. This image is also overlaid with shadows from KAGUYA Laser Altimeter (LALT) topographical data to show how it corresponds to the terrain on the Moon.
Multiple-band maps made in this manner are digital files with layers corresponding to the number of two-dimensional digital image bands. In astronomy and in earth and planetary science, files like these are also called cube files. Spectroscopic data which covers the entire observation wavelength range is also called hyperspectral data.
This hyperspectral map of lunar surface reflectance is useful for geological analyses of the Moon. A geological classification map was created using the clustering method in research paperHareyama et al. (2019).As an application, the National Institute of Advanced Industrial Science and Technology (AIST) also developed a scheme to use this model for optical observation instruments in other spacecrafts and satellites to observe the Moon and perform calibrations (i.e. health check of instruments)(Kouyama et al. 2016).
References
- Hareyama M. et al. (2019). Global classification of lunar reflectance spectra obtained by Kaguya (SELENE): Implication for hidden basaltic materials. Icarus 321, 407–425. https://doi.org/10.1016/j.icarus.2018.11.016.
- Kouyama T. et al. (2016). Development of an application scheme for the Selene/SP lunar reflectance model for radiometric calibration of hyperspectral and multispectral sensors. Planet. Space Sci. 124, 76–83. https://doi.org/10.1016/j.pss.2016.02.003.
- Matsunaga, T. et al. (2008). Discoveries on the lithology of lunar crater central peaks by selene spectral profiler. Geophys. Res. Lett. 35, L23201. https://doi.org/10.1029/2008GL035868.
- Yamamoto S. et al. (2011). Preflight and inflight calibration of the spectral profiler on board Selene (Kaguya). IEEE Trans. Geosci. Remote Sens. 49, 4660–4676. https://doi.org/10.1109/TGRS.2011.2144990.
- Yamamoto, S. et al. (2014). Calibration of NIR 2 of spectral profiler onboard Kaguya/SELENE. IEEE Trans. Geosci. Remote Sens. 52,6882–6898. https://doi.org/10.1109/TGRS.2014.2304581.
- Yokota, Y. et al. (2011). Lunar photometric properties at wavelengths 0.5-1.6 acquired by Selene spectral profiler and their dependency on local albedo and latitudinal zones. Icarus 215, 639–660. https://doi.org/10.1016/j.icarus.2011.07.028.