PRODUCTS
Moon Posters
We produce and publish two types of global moon surface maps. Please use them in settings such as public relations and education.
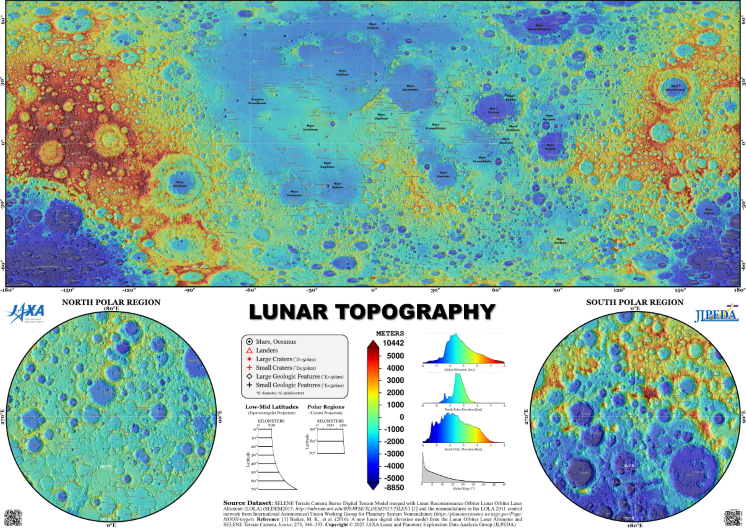
Elevation on the moon is expressed as elevation relative to the moon’s mean radius (1,737.4 km). The dark regions called maria on the Moon’s near side (refer to the false coloration map below) are smoother and relatively lower in elevation than the areas around them. Conversely, the lighter-colored regions referred to as the highlands have many sinkholes called craters. These areas are characterized as being rugged, with relatively higher elevation. The region with extremely low elevation at both lower sides of the low- to mid-latitude map is called the Aitken Basin, which is said to be the largest crater in our solar system. This elevation data was created based on observation data from the terrain camera on JAXA’s KAGUYA lunar orbiter and the Laser Altimeter aboard the NASA’s Lunar Reconnaissance Orbiter lunar orbiter.
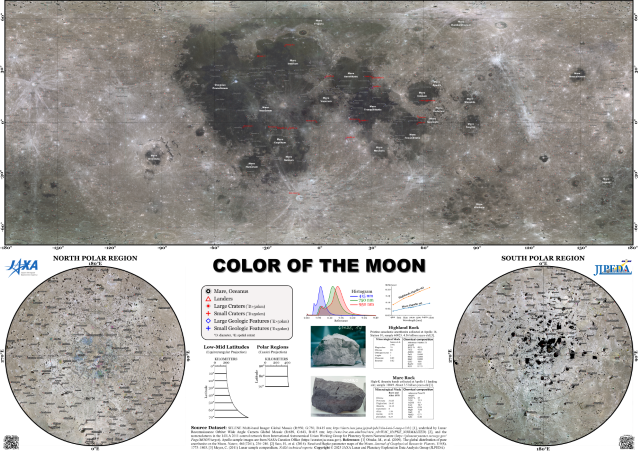
Almost entirely monochrome when seen with the naked eye, the moon can be seen in a kaleidoscope of colors when observed broken into in different wavelengths. In the centers of the maria (darker areas on the near side), there are even darker regions and also regions that appear slightly greener. The blackish regions have high titanium content and reflect less light than other mare areas. On the other hand, we can see even brighter radiation in the lunar highlands (regions slightly brighter than the brown mare areas). This indicates the presence of ejecta (sediment exposed and launched upon meteorite impact) from craters formed in more recent times. This bright surface color is lost over time due to space weathering. This albedo data was created based on observation data from the Multiband Imager (MI) on JAXA’s KAGUYA lunar orbiter and the Wide Angle Camera (WAC) aboard the NASA’s Lunar Reconnaissance Orbiter lunar orbiter.